



Industrial case
A plant belonging to a brewing group with operations in Mexico. We found a gap between what their planning tool assumed as a constant and what actual measurement showed.
Verifiable case · shared on a call

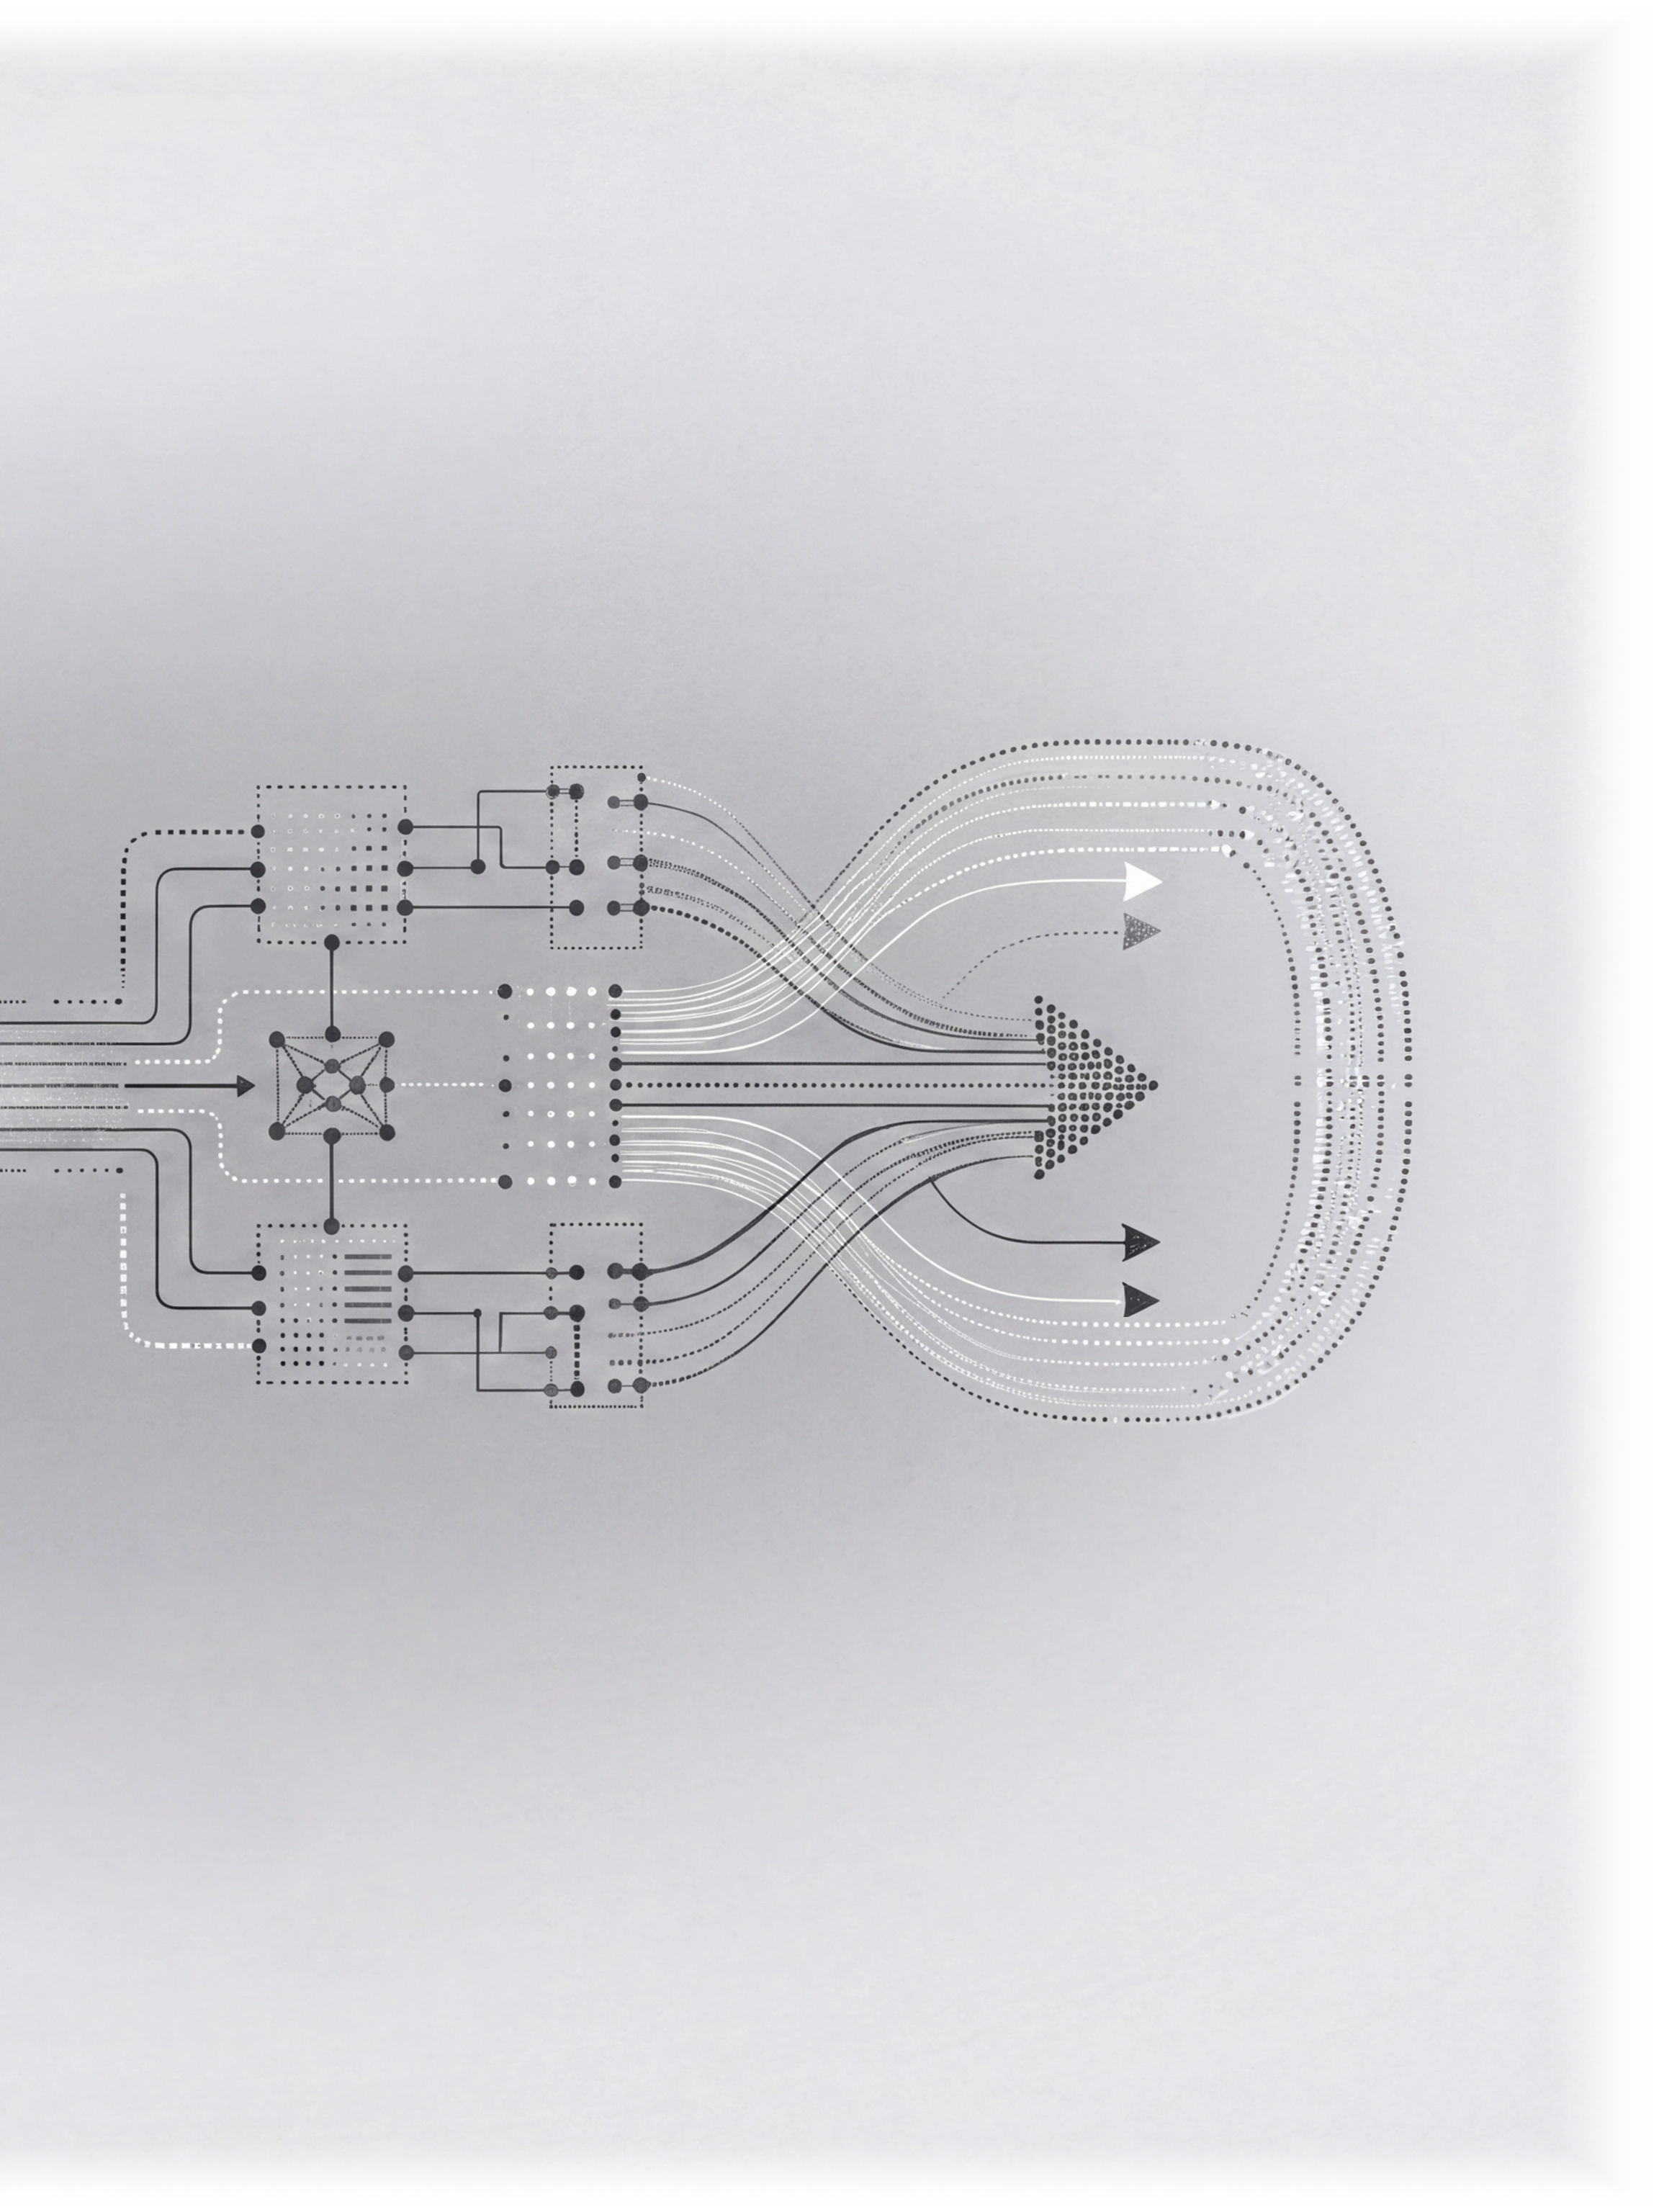
We read, in full, the data your plant already generates (logbooks, sensors, shift reports, spreadsheets) and turn it into findings with evidence.
A handwritten logbook, a sensor, an Excel file, the shift-change WhatsApp.
Everything gets recorded somewhere, and nothing is looked at together:
decisions are made with part of the information
and the rest is discovered too late.
The meeting is at 9. The numbers are in three places and they don’t match.
Nobody is doing anything wrong.
It’s how it has always been done.
We start from the logbooks, sensors and spreadsheets your plant already uses. We build in parallel, without stopping your operation or switching off what you already use.
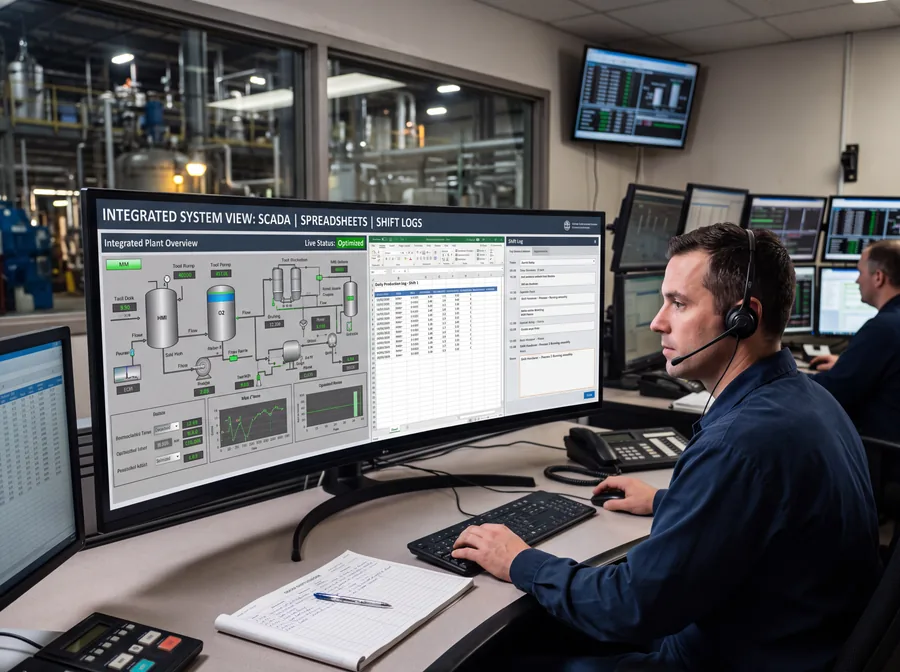
What you already use stays: SCADA, ERP, spreadsheets.
We build while your plant keeps running.
You don’t need new hardware or servers at your plant.
Your data is yours. Always.
AI built into your operation: predictive models, anomaly detection and questions in plain language, all on the same data.
You open it from your browser or phone. Nothing running on your machines.
Predictive models built on your operation’s history anticipate consumption, deviations and targets at risk.
Every reading is compared against its own history. What goes out of range shows up before it becomes a trend.
The alert reaches the channel your team already checks, not another tool you have to open.
Every data point with its source, every movement with its date.
Every record keeps who captured it, when, and where it came from.
Four areas. They combine depending on what your operation already generates.
Same reality.
More value.
We start from your data. We solve what costs you time, money or control today.
Logbooks, sensors and shift reports that finally add up; energy consumption you can explain. No migrating the source systems.
Findings, action plans and due dates visible before they become urgent. Every finding with an owner, a date and evidence.
Targets checked against real capacity, indicators that add up, and the answer to your question with its source. Less time gathering data, more time deciding.
Equipment, spare parts and field material, located and reconciled. With the trail of how each number was reached.
SCADA, spreadsheets, shift logbooks: every source stays where it already lived. The system reads them as they are and builds the complete view without asking the plant to change where it captures data.
Nothing to migrate. Nothing to train from scratch.
Every finding has an owner, a date and evidence from the moment it’s recorded. When the audit comes, the status already exists: no rebuilding it the night before.
Traceability isn’t a separate report. It’s the same data, already in order.

Before, the 9 o’clock meeting was spent deciding which number to believe. With the data already cross-checked, it’s spent deciding what to do.
Targets are compared against what the plant can actually produce. If a target was never achievable, you see it with evidence.
And when a specific question comes up, you ask it in plain language: the answer arrives with the data and its source.
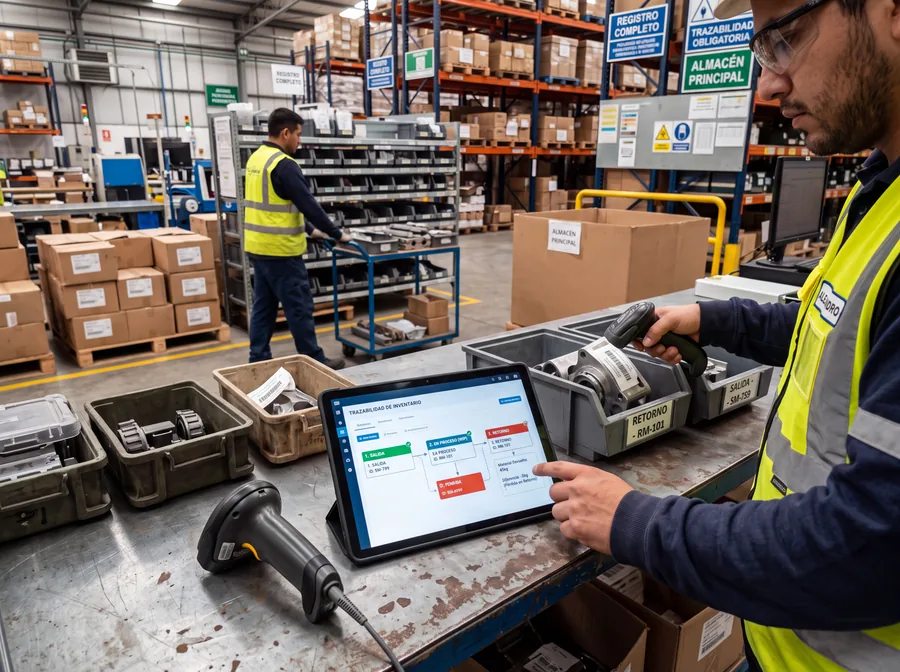
Most systems record what left the warehouse. This one also tracks what was used and what came back, and leaves the trail of how each number was reached.
Material gets lost on the way back, not on the way out. That’s why the difference matters.
We work inside industrial plants in Baja California, including the Heineken plant in Tecate.
A plant belonging to a brewing group with operations in Mexico. We found a gap between what their planning tool assumed as a constant and what actual measurement showed.
Verifiable case · shared on a callA rental and service company with field technicians. We found that a large share of their customers weren’t correctly linked to their installed equipment in the source system.
Verifiable case · shared on a callFor mid-size and large industrial, manufacturing and operations companies. Where a wrong number costs money, or an audit.
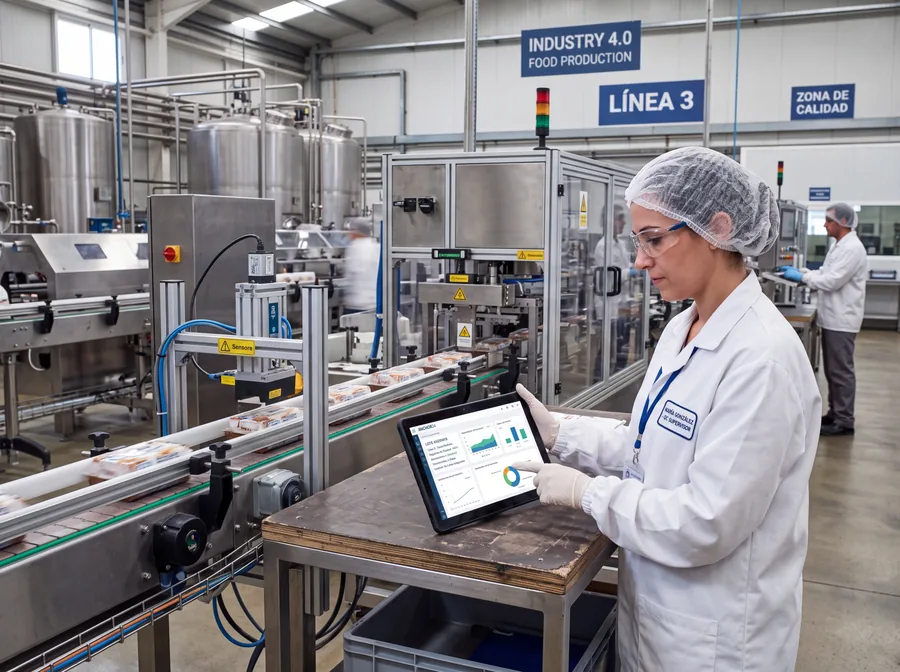
Line readings, quality records and lot control usually live in different systems. ANCHOR24 reads them where they already are and builds the lot file without capturing anything twice.
The result is a view by line and by shift, and a trail of every deviation with its owner.
When a review comes — from a customer, a certifier or internal — the file already exists. It isn’t put together that week; it’s looked up.
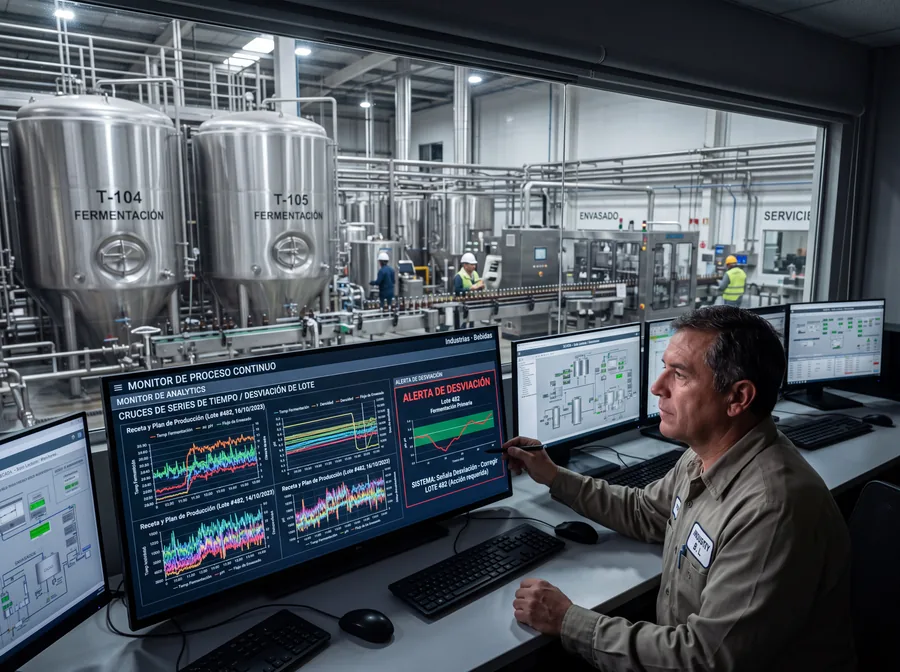
Fermentation, packaging and utilities generate dense time series. The system cross-checks them with the production plan and flags the deviation while the batch can still be corrected.
Without touching the SCADA: it’s read, not replaced.
Temperature, pressure and recipe times are compared against the standard as they happen, not at the end of the shift — the alert arrives while the process is still running.
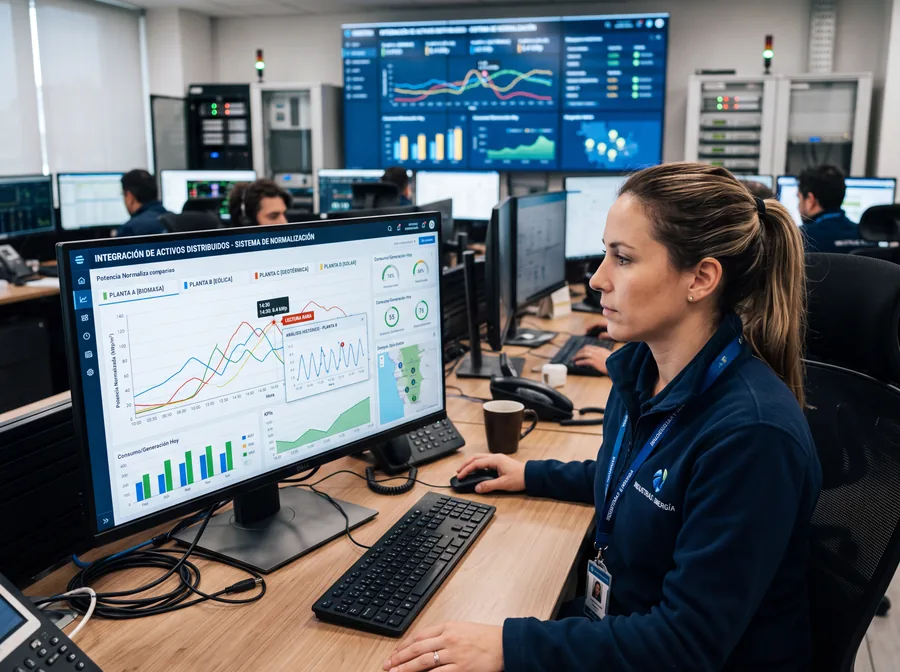
When measurement points are spread across several sites, the problem isn’t measuring: it’s comparing. The system normalizes the readings and puts them on the same axis.
History is included, so an odd reading is read against its own behavior.
Consumption or a loss that goes out of range is detected against its own history, before it becomes a trend that’s hard to explain.
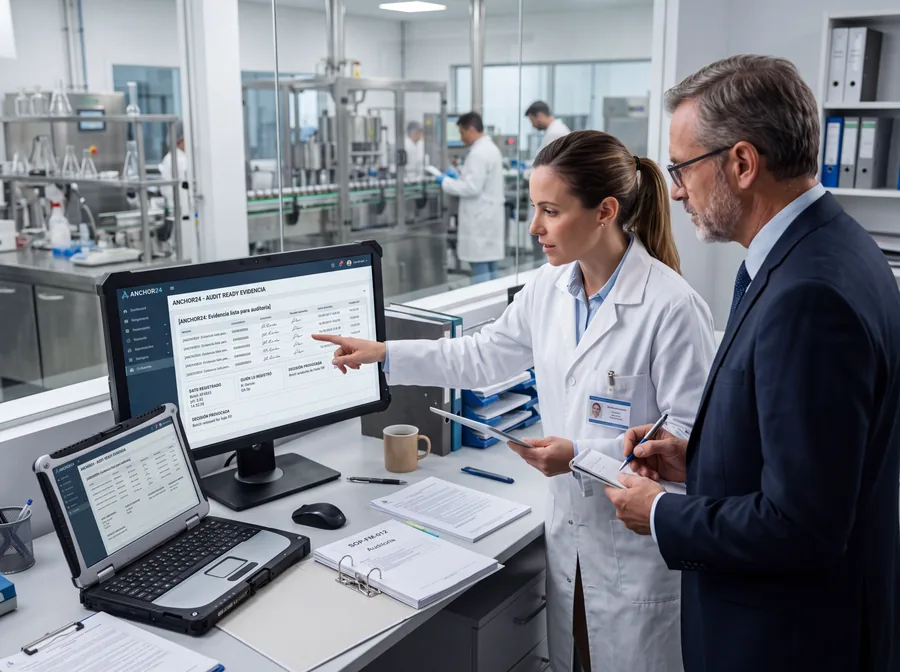
The requirement isn’t just to comply: it’s to be able to prove it. ANCHOR24 keeps the link between the data, who recorded it and what decision it triggered.
The file is looked up on the spot, not put together the night before.
When the auditor asks about a specific lot, the answer already exists — no rebuilding the chain from scratch.
Tell us what’s in your operation.
We reply within 24–48 h.
We start with your operation’s real data, not a generic demo. We sign an NDA before receiving any data.